Turned Yellow Case Study – Google & Facebook Ads: +500% Revenue Growth in 90 Days
Turned Yellow
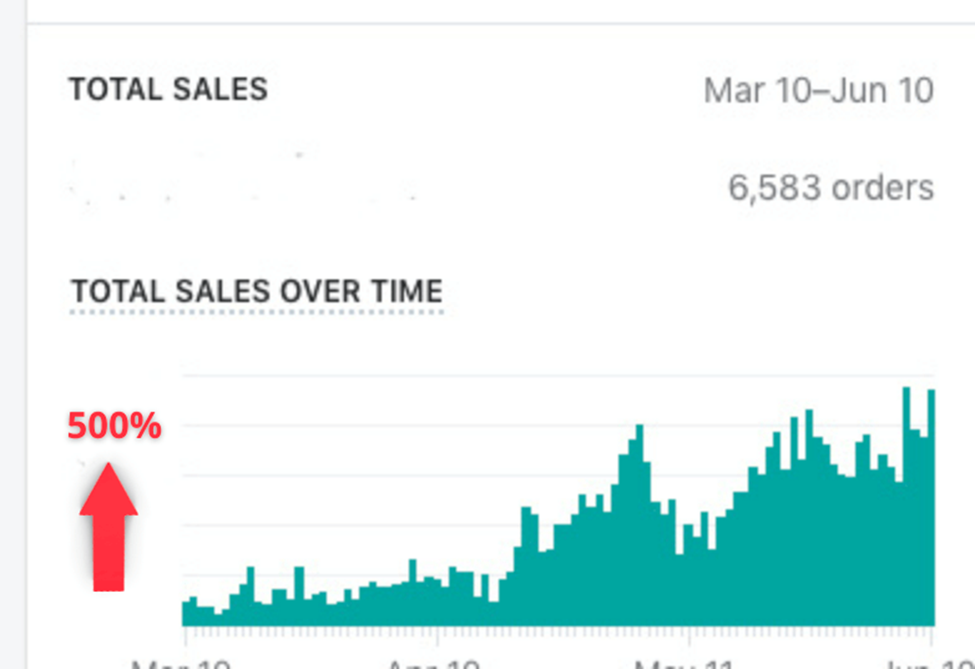
OVERALL RESULTS SO FAR
About the Client
Turned Yellow is an American direct-to-consumer brand that turns customer-submitted photographs into hand-drawn, Simpsons-style caricature portraits. The company sells exclusively through its own Shopify storefront to consumers across North America, Europe, and Australia. It sits in the personalised gifts and custom digital art vertical, where barriers to entry are low, overseas competitors undercut on price constantly, and margins punish any brand that cannot acquire customers efficiently at scale.
If your ad account looks profitable at modest spend but falls apart the moment you try to grow, Turned Yellow‘s story is worth reading. Orange Trail’s performance marketing framework solved that exact problem, as detailed in this case study.
Client Snapshot
Turned Yellow had carved out a loyal following on the strength of its product. Customers loved the portraits, reorder rates were healthy, and the brand had built traction without leaning heavily on paid channels. Where things broke down was on the acquisition side. The company had cycled through multiple agencies and freelance media buyers, and none of them had figured out how to scale paid ads without torching the margins. Patience and budget were both wearing thin.
Field | Detail |
Brand | Turned Yellow |
Founded | United States |
Industry | Custom artwork / personalised gifts / ecommerce |
Business Model | DTC (direct-to-consumer) via Shopify |
Channels | Google Ads, Facebook/Meta Ads |
Markets | US, UK, EU, AU |
Engagement Period | Ongoing (results reported from first 90 days) |
“We’d tried boosting spend three or four times before, and each time the numbers just fell apart. We needed someone who actually understood how to test creatives systematically and fix the Google Ads keywords that were bleeding budget. Orange Trail didn’t just promise scale. They showed us the framework on the first call, and it made sense immediately.” Turned Yellow, Founder
The Challenge
When Turned Yellow approached Orange Trail, the frustration was specific and well-documented. The brand had tested its scaling threshold three or four separate times. At low spend, the numbers worked. But, when they pushed the budget up by 30% to 50%, CPA spiked hard within seven to ten days, enough to erase the additional revenue entirely.
The surface-level symptoms were easy to name: creative fatigue, rising CPMs, scaling instability. But those symptoms were masking a structural problem nobody had identified, because it hid behind metrics that looked healthy.
The entire ad account had been optimised for volume, not value. Facebook’s algorithm was doing exactly what it had been told to do: find the cheapest conversions it could. For Turned Yellow, that meant funnelling spend toward low-AOV single-portrait orders rather than the higher-margin family portraits and group caricatures that drove profitability. Cost per purchase looked acceptable at a glance, and ROAS seemed stable at modest spend levels. But the algorithm was feeding the brand its least profitable customers, and nobody had noticed because nobody was looking at what was being purchased, only at how many purchases were happening.
Without value-based optimisation in place, without segmentation of product types within ad sets, every scaling attempt attracted a disproportionate share of low-value buyers. Margins compressed, the team cut budget, stability came back, growth stalled, and the cycle repeated. Tactics like “increase budget slowly” and “launch more lookalike audiences” had failed not because they were bad ideas, but because they could not fix the underlying optimisation signal the algorithm was chasing.
Specific Problems
Creative fatigue across all top-performing ad sets. The same three to four video and static creatives had been running for over five months with no structured testing pipeline in place, so frequency scores had climbed above 4.0 and CPMs had risen by an estimated 35%. The brand lacked access to a dedicated creative production process capable of producing fresh assets at the pace the account needed.
Google Ads budget leaking to irrelevant search queries. Broad match keywords in Google Search campaigns were consuming approximately 40% of monthly spend on terms with zero purchase intent. The account was paying for clicks from people who would never buy a custom portrait.
No funnel segmentation in Facebook Ads. Prospecting, retargeting, and re-engagement audiences sat in a single campaign structure, which made budget allocation by funnel stage impossible and turned performance attribution into guesswork. The algorithm had no clear signal about which users were cold and which were warm.
Scaling attempts consistently eroded profitability. Three previous attempts to increase daily spend by 30% to 50% had produced CPA increases that wiped out margin gains within seven to ten days. The pattern was consistent enough that the team had stopped trying.
No creative strategy framework. New ad creatives came from instinct rather than data, and without a hypothesis behind any given asset, there was no mechanism for learning from what failed or building on what worked.
The Stakes
Without intervention, revenue would flatline and the business would lean harder on organic traffic and repeat customers while competitors with better-optimised paid strategies took market share. The founders were also approaching a more fundamental decision. After investing in multiple agency relationships without a clear return, there was serious talk of pulling back from paid advertising entirely and accepting a permanently lower ceiling for the business.
Our Approach & Strategy
Orange Trail’s approach began with two weeks of diagnostic work before a single new campaign went live. The team’s view was simple: you cannot scale what you cannot test, and you cannot test without a system. From the diagnostic findings, Orange Trail implemented its 3 Point Scaling System, a proprietary framework within the agency’s performance marketing methodology. The system synchronises creative testing velocity, audience segmentation, and budget allocation across Google and Facebook so the two channels scale together rather than independently.
Phase 1: Diagnostic Audit and Market Research (Weeks 1 to 2)
The first action was a full-account audit across both Google Ads and Facebook Ads Manager, conducted through Orange Trail’s agency ad accounts infrastructure. On the Google side, the team pulled search term reports spanning 90 days and found 127 individual search queries consuming meaningful budget with zero correlation to actual purchases. Those terms went onto negative keyword lists, and the reclaimed budget was redirected toward high-intent, product-specific phrases: “custom caricature portrait gift,” “personalised cartoon family portrait,” “Simpsons-style drawing from photo.”
On Facebook, the team mapped every active audience, creative asset, and campaign objective against each other. Two supposedly distinct retargeting audiences shared 68% of their users, which meant the brand had been bidding against itself for the same eyeballs. Combined with the AOV optimisation problem uncovered in the challenge analysis, the picture was clear: the account’s architecture was actively working against the brand.
Orange Trail also ran competitor and market research across the personalised artwork and custom gift vertical, analysing ad libraries, landing page structures, and offer positioning for the top 15 competing brands. That research became the starting material for Phase 2.
Phase 2: Creative Testing Infrastructure (Weeks 2 to 4)
With the diagnostic complete, the team built a structured creative testing pipeline through Orange Trail’s high-ROI creative production service. Every new asset had a hypothesis behind it, derived from the market research rather than instinct or preference. The framework tested three variables: hook (the first three seconds of a video, or the headline of a static ad), social proof mechanism (UGC, reviews, before-and-after comparisons), and offer framing (percentage discount versus fixed amount versus free shipping versus urgency).
A minimum of four new creative variants entered a dedicated testing campaign each week, with controlled budget and audience parameters. Winners graduated to scaling campaigns only after hitting statistical significance across a minimum of 1,000 impressions and 50 link clicks. Previous agencies had launched creatives and evaluated them on gut feeling after a few days of data, but Orange Trail’s framework made the evaluation mechanical.
The single highest-performing creative from the entire engagement was a screen recording of a customer’s Turned Yellow order being illustrated. Shot on a phone. No editing. It beat every professionally produced asset by 2.3x on cost per add-to-cart.
Phase 3: Funnel Restructure and Audience Segmentation (Weeks 3 to 5)
The Facebook account was rebuilt into a three-tier funnel: top-of-funnel prospecting campaigns targeting broad and interest-based audiences, mid-funnel engagement retargeting reaching video viewers, page engagers, and add-to-cart users who had not purchased, and bottom-funnel conversion retargeting going after checkout initiators and past purchasers for upsell. Each tier got its own campaign with independent budget control, creative sets matched to the audience’s awareness level, and distinct optimisation objectives.
On Google, the team separated brand search, non-brand search, Google Shopping, and Display retargeting into individual campaigns with tailored bidding strategies. Shopping campaigns were segmented by product category and margin tier so that high-AOV products (family portraits, group caricatures) received proportionate budget instead of competing for spend with lower-margin single portraits. All of this ran through Orange Trail’s agency ad accounts, which kept the account stable during a rapid restructuring.
Phase 4: Scaling via the 3 Point Scaling System (Weeks 5 to 12)
With creative winners in hand and the funnel infrastructure live, the team activated the 3 Point Scaling System. The framework coordinates three levers at once: horizontal scaling (pushing winning creatives into new audience segments), vertical scaling (incrementally increasing budget on proven combinations), and geographic expansion (extending top performers into secondary markets). For Turned Yellow, that meant the UK, Australia, and select European countries.
Budget increases followed a strict cadence: no single ad set received more than a 20% increase within a 72-hour window, and every increase was paired with a performance threshold so that if CPA rose above target within 48 hours, the increase was reversed immediately. Previous scaling attempts had collapsed because nobody enforced those guardrails.
The Week-Six Decision
At week six, the team hit a fork. Turned Yellow’s best-performing Facebook campaign was optimised for add-to-cart events, not purchases. The volume of add-to-cart signals was feeding the algorithm rich data and keeping CPAs low, but only 31% of those add-to-carts were converting into purchases, well below the 40% benchmark for the vertical.
Two options were on the table. Option A meant switching the optimisation event to purchase, which would reduce the signals flowing to the algorithm and trigger a learning phase reset, but would theoretically attract higher-intent users through the front door. On the other hand, Option B meant keeping the add-to-cart optimisation running and building a dedicated retargeting sequence to convert the 69% who were dropping off before checkout.
The team went with Option B. The add-to-cart campaign had just exited its learning phase and was performing at its best, so resetting it meant real risk, especially during a scaling push across multiple geographies. But building the retargeting sequence could be tested and tuned without touching the campaigns that were already working.
The team built the sequence in three steps: a reminder ad within 24 hours, a social proof ad at 48 hours featuring customer reviews and UGC produced by Orange Trail’s creative team, and a time-limited offer at 72 hours. Within three weeks, the add-to-cart-to-purchase conversion rate climbed from 31% to 44%.
Tools and Frameworks
The engagement used Meta Ads Manager and Google Ads for campaign management, Google Analytics for cross-channel attribution, and Triple Whale for supplementary server-side tracking and blended ROAS measurement. Orange Trail’s creative team tracked creative performance in a proprietary scoring matrix, and keyword research used Google Keyword Planner alongside competitor analysis via Meta Ad Library.
The Results
Metric | Result |
Revenue Growth | +500% increase in 3 months |
Total Sales Generated | $378,959+ in tracked revenue |
Creative Win Rate | Structured testing pipeline producing consistent weekly winners |
Google Ads Efficiency | Elimination of approximately 40% wasted spend through negative keyword refinement |
Geographic Expansion | Successfully scaled into UK, AU, and EU markets |
Results Narrative
Google Ads efficiency moved first. Within the opening two weeks, the negative keyword overhaul and campaign restructure cut wasted spend dramatically, and ROAS on the Google side improved almost immediately. The savings went back into higher-performing search and shopping campaigns without increasing total ad budget, which meant Google started pulling its weight for the first time in the account’s history.
The inflection point came in week five. The third batch of tested Facebook creatives, produced through Orange Trail’s high-ROI creative service, delivered two clear winners that outperformed every historical asset on cost per add-to-cart and cost per purchase simultaneously. Both were UGC-style assets featuring real customer reactions to receiving their Turned Yellow portraits. The team scaled them horizontally across multiple audience segments and geographies over the next four weeks. Combined with the rebuilt retargeting funnel, Facebook went from a break-even channel to the primary revenue driver.
By the end of month three, revenue had grown 500% compared to the pre-engagement baseline, with $378,959 in total tracked sales. ROAS held steady as spend increased, which broke the pattern of margin erosion that had followed every previous attempt to push the budget. For the first time, Turned Yellow could increase ad spend and watch profitability hold rather than collapse.
Context
The average ecommerce brand in the personalised gifts and custom artwork vertical sees 15% to 25% quarter-on-quarter revenue growth when scaling paid channels aggressively. Turned Yellow achieved a 500% lift in a single quarter, and against their own history, this was the first time the brand had increased spend by more than 30% without profitability declining in lockstep.
Honest Caveat
The 500% figure reflects growth from a constrained baseline. Turned Yellow had been deliberately limiting spend because previous scaling attempts kept failing, so the percentage is dramatic partly because the starting point was suppressed. Any agency can produce an impressive percentage by cherry-picking the comparison window.
The brand went from a position where scaling was impossible (every attempt had failed, multiple times, with multiple agencies) to one where growth was stable and profitable, and could be repeated without the margins collapsing.
Maintaining growth at this rate requires continuous creative production and testing, because without a sustained pipeline of new assets, performance plateaus as audiences saturate. These results are the product of an ongoing system, not a one-time intervention.
“The difference wasn’t just the results. It was that for the first time, we actually understood why things were working. We could see which creatives were winning, which audiences were converting, and where every dollar was going. That clarity is what gave us the confidence to keep scaling. We went from being afraid to increase budget to actively pushing for it.” Turned Yellow, Founder
Are you one of our next success stories?
Book a discovery call
General Industry FAQs
How can an online custom artwork or illustration store use Google and Facebook Ads to increase profitable sales?
Pair Google Search and Shopping campaigns (to capture buyers already looking for personalised artwork) with Facebook Ads (to build awareness and retarget browsers who left without purchasing). Structure campaigns by funnel stage so budget follows buyer readiness rather than letting the algorithm blend cold and warm traffic. UGC-style assets and before-and-after transformation visuals consistently outperform polished studio content in this vertical. Layer Google Display retargeting alongside Facebook retargeting to increase touchpoints without duplicating reach. Orange Trail’s performance marketing service builds this multi-channel structure for ecommerce brands.
What Google Search and Shopping campaigns are most effective for an ecommerce brand selling personalised artwork?
High-intent non-brand search campaigns targeting product-specific terms perform best. Phrases like “custom caricature portrait,” “personalised cartoon family drawing,” and “custom illustration gift” attract people who already know what they want. Google Shopping should be segmented by product type and margin tier so high-AOV items get proportionate budget. Brand search should run separately with lower bids. Negative keyword management is critical here, since broad match terms attract irrelevant traffic that wastes 30% to 40% of budget if nobody is pruning it. Orange Trail’s agency ad accounts provide the account stability needed for this level of granularity.
How should a custom gift or print-on-demand store combine Facebook and Google Ads to scale revenue while maintaining ROAS?
Treat each platform as a different stage in the buyer journey. Google captures existing demand from people already searching, while Facebook creates demand by introducing the product to new audiences. Use Facebook for prospecting and creative testing, then retarget engaged users across both Facebook and Google Display. Shift budget dynamically based on weekly blended ROAS, and use a unified attribution tool to avoid double-counting conversions.
How can a bespoke portrait or caricature business use Facebook Ads to drive more add-to-carts and completed orders?
Start by optimising campaigns for add-to-cart events to give the algorithm enough conversion data to learn from, then build a dedicated retargeting sequence to convert those add-to-cart users into buyers. The retargeting sequence should include a reminder ad within 24 hours, a social proof ad (customer reviews or UGC) at 48 hours, and a time-limited incentive at 72 hours. Video walkthroughs of the illustration process and side-by-side comparisons of the original photo with the finished caricature perform particularly well in this space. These are the kind of assets Orange Trail’s creative team produces at scale.
What Google keyword strategy works best for an online store selling unique personalised gifts and wall art?
Long-tail, product-specific keywords with clear purchase intent. Terms like “personalised family portrait gift,” “custom cartoon drawing from photo,” and “bespoke wall art print” convert at higher rates than broad terms like “personalised gifts” or “custom art.” Use phrase match and exact match for core terms, and maintain aggressive negative keyword lists to exclude informational queries that attract browsers rather than buyers. Segment campaigns by product category so budgets can be weighted toward the highest-margin items.
How can an ecommerce brand selling custom digital prints use retargeting on Facebook and Google Display to recover abandoned carts?
Coordinate retargeting across both platforms, sequenced by time since abandonment. On Facebook, use dynamic product ads showing the item left in cart, with a reminder within 24 hours and a small incentive at 48 to 72 hours. On Google Display, target cart abandoners with banner ads reinforcing the brand and the offer. Cap frequency at three to four impressions per day per platform to prevent fatigue.
Which Facebook ad creatives and offers convert best for a brand selling fun customised illustrations or posters?
UGC-style content where real customers react to receiving their finished portrait consistently outperforms studio-produced assets. Screen recordings of the illustration process showcase the craft and differentiate from cheap alternatives. Percentage discounts tend to outperform fixed-amount discounts in this price range, and “buy one, get one at 50% off” bundles drive higher AOV. Urgency framing like “order by Friday for delivery before [holiday]” performs strongly during gifting seasons.
How can an online art shop structure Google and Facebook measurement to track purchases and optimise for high-value buyers?
Implement server-side tracking via the Meta Conversions API and Google’s enhanced conversions to reduce data loss from browser privacy restrictions. Use a unified analytics platform (Triple Whale, Northbeam, or similar) for blended cross-channel attribution alongside native platform reporting. Set up value-based optimisation on Facebook by passing actual order values with purchase events, which trains the algorithm to prioritise higher-AOV customers instead of chasing the cheapest conversions. On Google, use target ROAS bidding strategies informed by accurate conversion value data.
What is the best full-funnel ad strategy across Google and Facebook for a niche ecommerce brand in the custom art space?
Three tiers work best. At the top, Facebook prospecting with broad and interest-based audiences introduces the brand. In the middle, retarget engaged users across both Facebook and Google Display with social proof and product education. At the bottom, Google Search and Shopping capture high-intent searchers while Facebook retargeting closes cart abandoners. Allocate roughly 60% to prospecting, 25% to mid-funnel, and 15% to bottom-funnel, adjusting as data comes in. Orange Trail builds this structure through its performance marketing programme.
How can a small DTC brand selling personalised gifts use Google and Facebook Ads to profitably scale international orders?
Establish a profitable baseline in your primary market before expanding. Once you have winning creatives and proven funnels, duplicate top-performing campaigns into secondary markets (typically UK, Australia, and select EU countries for English-language brands). Localise ad copy, currency, and shipping messaging. Start with small daily budgets per geography and scale only campaigns hitting target CPA within the first 14 days. Orange Trail’s agency ad accounts support multi-geo deployment with whitelisted stability across regions.
Turned Yellow-Specific FAQs
What is the Turned Yellow case study about?
The Turned Yellow case study documents how Orange Trail helped an American custom caricature brand achieve 500% revenue growth and generate $378,959 in sales within three months through a restructured Google and Facebook Ads strategy. It covers the challenges of scaling in a competitive personalised gifts market, the diagnostic and creative testing methodology applied, and the results achieved across both paid channels.
How did Turned Yellow use Google Ads and Facebook Ads together?
Turned Yellow used Google Ads to capture high-intent search traffic from people looking for custom caricature services. Facebook Ads handled prospecting new audiences and retargeting website visitors. The two platforms ran as a unified system through Orange Trail’s performance marketing framework, with coordinated budget allocation, shared audience insights, and cross-platform retargeting across the buyer journey.
What were the results of the Turned Yellow advertising campaign?
Turned Yellow achieved a 500% increase in revenue within three months, generating over $378,959 in tracked sales. Google Ads efficiency improved after negative keyword optimisation eliminated approximately 40% of wasted spend. Facebook Ads went from a break-even channel to the primary revenue driver through systematic creative testing and funnel segmentation.
How much ROI did Turned Yellow achieve from paid ads?
The campaign produced a 500% revenue increase over the pre-engagement baseline within 90 days. ROAS held steady as ad spend increased, which broke the previous pattern where scaling always led to margin erosion. Specific budget figures have not been disclosed.
What Google Ads strategy did Turned Yellow follow?
The strategy focused on three actions: eliminating wasted spend by adding 127 irrelevant search queries to negative keyword lists, restructuring campaigns to separate brand, non-brand, Shopping, and Display into distinct campaigns with tailored bidding, and segmenting Shopping campaigns by product category and margin tier to prioritise high-AOV items like family portraits and group caricatures.
How did Turned Yellow optimise their Facebook Ads for conversions?
The Facebook account was restructured into a three-tier funnel with dedicated budgets and high-ROI creative sets for each tier. A testing pipeline produced a minimum of four new variants per week, with winners graduated only after reaching statistical significance. At week six, the team maintained add-to-cart optimisation rather than switching to purchase events and built a retargeting sequence that improved the add-to-cart-to-purchase rate from 31% to 44%.
What budget did Turned Yellow allocate for Google and Facebook Ads?
Specific figures have not been disclosed. Previous attempts to increase daily spend by 30% to 50% had failed consistently. Under the new strategy, increases were capped at 20% per ad set within any 72-hour window, with automatic rollback if CPA exceeded target within 48 hours. Allocation between platforms shifted dynamically based on weekly blended ROAS.
What audience targeting did Turned Yellow use in their ad campaigns?
On Facebook, broad and interest-based audiences for prospecting, with engagement-based custom audiences for retargeting. The previous 68% audience overlap between retargeting segments was eliminated through restructuring. On Google, the shift was from broad match to phrase and exact match on high-intent, product-specific terms.
How can small businesses replicate the Turned Yellow ads strategy?
Audit search term reports to eliminate wasted Google Ads spend, build a structured Facebook creative testing pipeline with a hypothesis behind each asset, separate campaigns by funnel stage, and scale budget incrementally with strict CPA thresholds. Run Google and Facebook as a unified system rather than independent channels. Structured testing and disciplined scaling outperform intuition at every budget level, and Orange Trail’s performance marketing service implements this framework for ecommerce brands.
What lessons can marketers learn from the Turned Yellow case study?
Creative fatigue is the most common hidden bottleneck in Facebook Ads scaling. Google Ads accounts in niche ecommerce verticals routinely waste 30% to 40% of spend on irrelevant queries. Optimising for add-to-cart rather than purchase can give the algorithm stronger data when paired with a retargeting sequence that closes the conversion gap. Sustainable scaling needs a system, not just more money. Brands serious about building that system can explore Orange Trail’s performance marketing and agency ad accounts services.
Ready to scale? Let's talk this week.
No long-term contracts. No fluff calls. In 30 minutes, Orange Trail will audit your current ad account structure, identify your biggest growth lever, and give you a concrete next step, whether you work with them or not. The same performance marketing team that delivered $378,959 in sales for Turned Yellow is ready to look at your account.